In late March, the social media analysts at Buffer shared,“The Ideal Length of Everything Online, Backed by Research.” A few days ago, the folks at AdWeek turned all this data into a fun, easy-to-scan infographic that’s definitely worth hanging next to the desk of any social media manager. We’ve reposted the full infographic at the bottom of this blog post.
Optimizing Length of Content – The Highlights
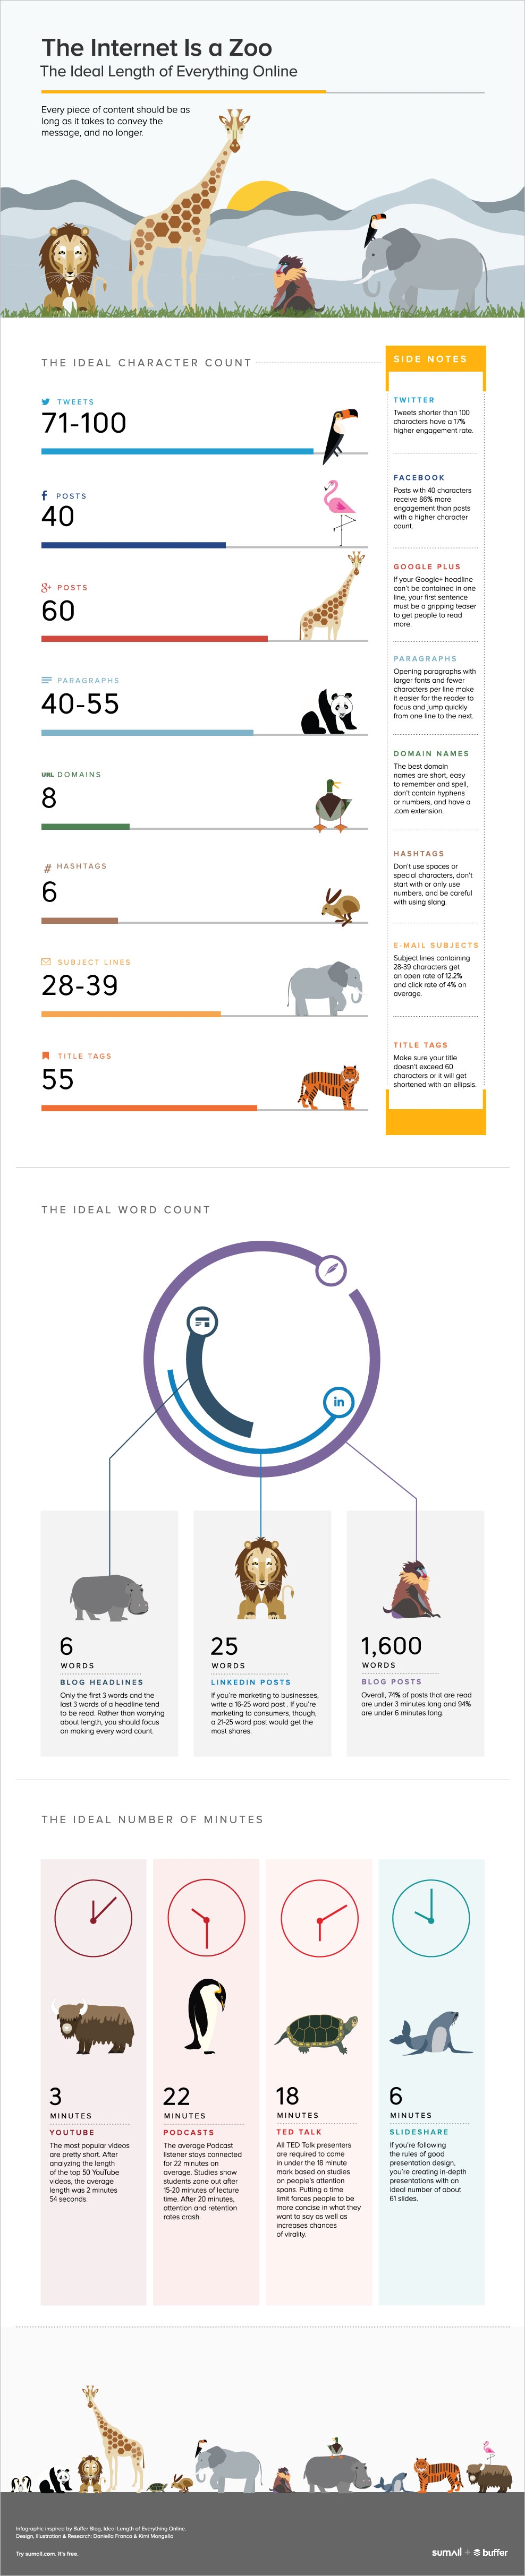
Here are a few highlights from the AdWeek infographic:
- Tweets should be less than 100 characters
- Facebook posts should be less than 40 characters
- Paragraphs should be less than 55 characters (per line).
- URL domains should be less than 8 characters (and easy to remember with a “.com” extension)
- Most blog posts should take less than 3 minutes to read. Nearly all blog posts should take less than 6 minutes to read.
Is Optimized Length Really That Important?
Of course, marketing is one giant experiment that combines data, art, analytics, psychology, and a number of other subspecialties. Qualifying the perfect length of a piece of content only takes into account the data/analytics side of things.
I like to think of this quote, frequently attributed to Pablo Picasso:
“Learn the rules like a pro, so you can break them like an artist.”
In order to create truly great web content, it’s important to know the rules. The “rules” provide you with an understanding of what generally works and what generally doesn’t. But, as one commenter points out in the AdWeek piece, “Average ≠ ideal.”
The average/“perfect” character length for a URL domain isn’t always going to be 8 characters or less. And the best Tweets won’t always be under 100 characters. If you want to create something that gets noticed, you’re going to have to think outside the box.
Should I Bother With Knowing the “Perfect Length of Content?”
Yes, by all means. Study this infographic. Make these best practices your best practices.
Then go break the rules.
What do you think about this infographic? Do you find these kinds of data-driven suggestions helpful? Or, do you prefer to go your own way? I’d love to hear your opinions in the comments section below!
No comments:
Post a Comment